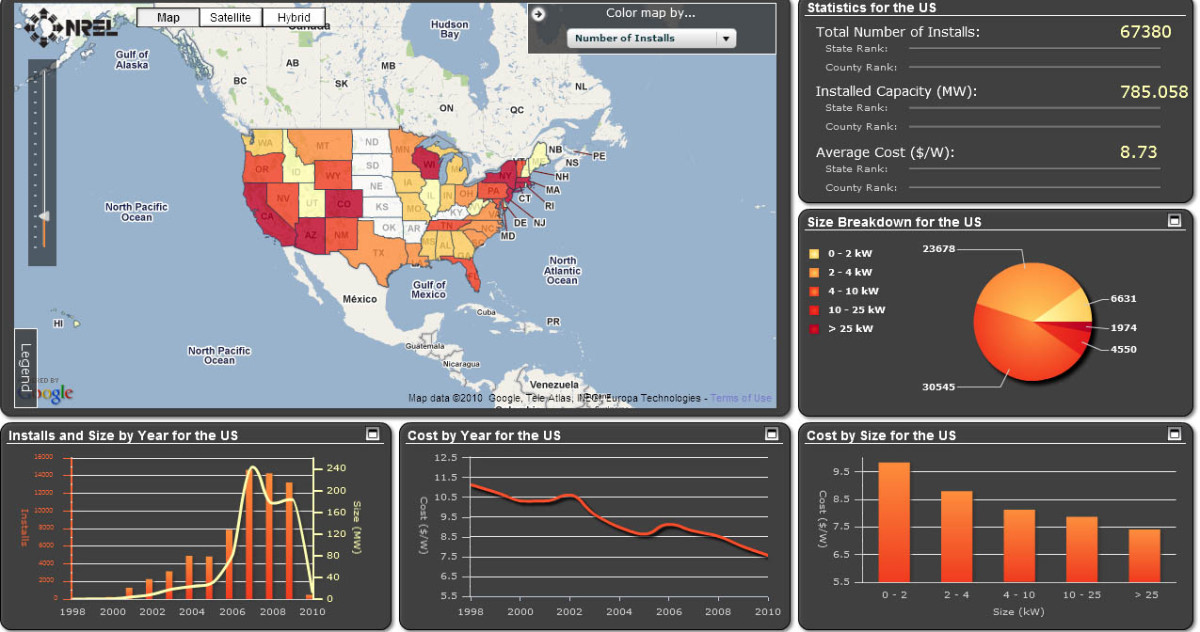
Have you ever wondered what it would be like to actually watch the solar movement grow right in front of your eyes? If the answer is yes, then have we got a tool for you! The solar industry now has eye-popping, interactive maps and charts that show where PV systems are being installed, how big they are, how much they cost and how fast the industry is booming. All of this information is publicly available thanks to the National Renewable Energy Laboratory’s new Open PV Project, which tracks the solar industry data from 1998 to present. So far, Open PV has catalogued more than 67,000 systems.
"We're building a community of users who are willing to share information about PV installations," said Christopher Helm, a Geographic Information System (GIS) developer and project manager for the Open PV project. "The project is a living, breathing and dynamic database that people can use to explore the U.S. PV market in essentially real-time."
Want to know how fast solar is growing in Arizona? Click "Explore" on the website to open the PV Market Mapper application and look up any state in the U.S. to see graphs showing the number of PV installations, cost and capacity over time.
Unfortunately, there has not been enough information provided for solar installations in Tucson, so if you have a solar PV system and would like to enter your information into the database, you can do so by clicking this link and contributing. The PV Project is a collaboration between the government, industry, and the public. Users are able to add their own PV installation data if they would like to participate in the project. It’s a great way to share and contribute to the spreading of solar knowledge.

